written by Leszek Orman, Radziszow / Poland; Hans-Walter Swidersky, Hannover / Germany

3  Results and discussion / Part 2

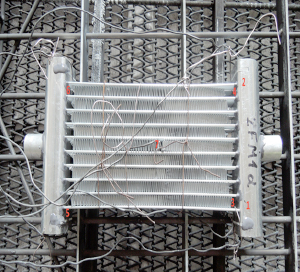
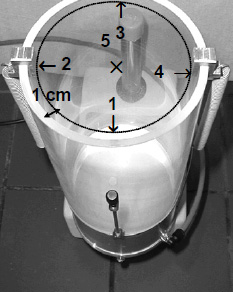
Corrosion resistance of the mock up samples was checked in the so called soaking test.  Exemplary structures are shown in fig. 4:


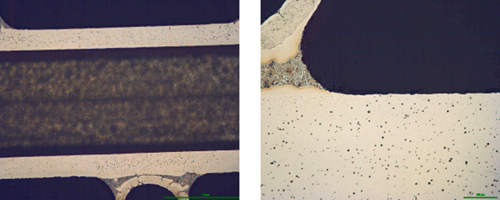
Fig. 4: Exemplary metallographic cross sections after 60 days of soaking (flux load 16g/m2, tube: HA 9170) 

Observation of metallographic structures did not allow for a univocal statement that there are certain differences between investigated parts. In none of the investigated cases a fin debonding process was observed. At longer time of soaking, intensive corrosion of fins could be observed. More details were obtained when measuring the thickness of the tube walls. These results are presented in fig. 5:


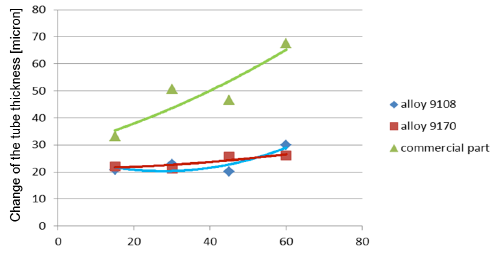
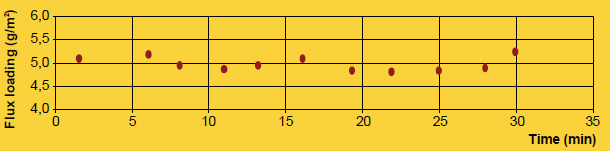
Fig. 5a:
Change in the tube wall thickness as a function of soaking time – Time of soaking [days] – Flux load 8 g/m2

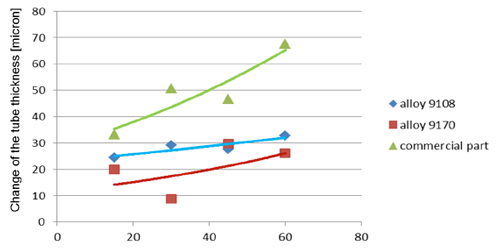
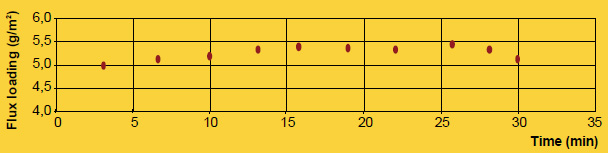
Fig. 5b: Change in the tube wall thickness as a function of soaking time – Time of soaking [days] – Flux load 16 g/m2

It seems that thinning of tubes at the beginning of the soaking test is quite rapid as compared to the period of soaking longer than 15 days.  In case of the NOCOLOK® ZnLi Flux, the maximum tube thinning is in the range of 30 microns.  The same maximum value for the commercial part is in the range of 65 microns.  There is no significant difference in the tube thinning between the two tested different alloys.

Industrial test

The industrial test was performed with condensers used for stationary application. However, they had a typical design as for automotive. In this case – since the standard production tube were not zinc coated – the testing was done using NOCOLOK® Li Flux.

Material of the tested part:
Fins: FA 6815 clad 4343 both sides
Tubes: HA9108
Manifolds: HA3905-R outside clad HA4045-D

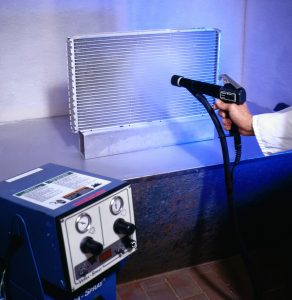
Brazing was performed on industrial brazing line made of wet fluxer, dryer and Active Only (Seco/Warwick) brazing furnace.  Fluxing was done with NOCOLOK® Li Flux – concentration 13% for overhead spray and 43% for tube to manifolds joints.  The above concentrations were the same as for standard industrial production.  Also no changes were done in brazing parameters as compared to standard conditions.

Corrosion resistance of the brazed parts was checked by SWAAT (ASTM G85 A3).  In order to examine the parts after different times at SWAAT, a brazed part was segmented, and all the segments were tested in the same test chamber – but for different time periods.

Examination of the segments after 5 days in SWAAT did not reveal any significant progress of corrosion; however, after longer times, fin debonding was observed.  This examination did not show any differences between the parts fluxed with NOCOLOK® Li Flux and those fluxed with standard NOCOLOK® Flux.  More information was obtained when examining metallographic cross sections:


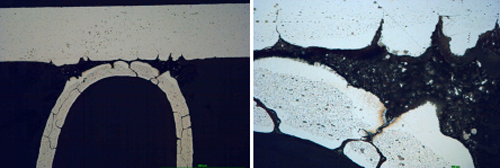
Fig. 6a: Structure of the samples brazed with NOCOLOK® Flux after 5 days in SWAAT 

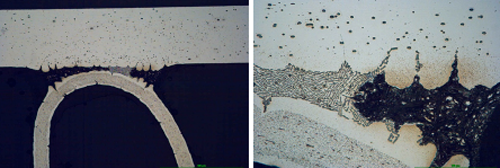
Fig. 6b: Structure of the samples brazed with NOCOLOK® Li Flux after 5 days in SWAAT

It can be observe that initially corrosion starts as intergranular attack on the fin material and as an intensive attack on the filler alloy. The filler is attacked selectively; firstly the alpha phase of the eutectic is removed.


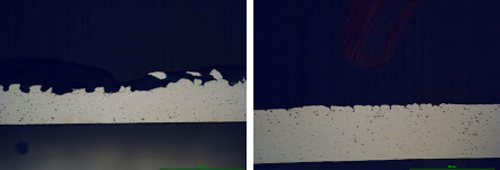
Fig. 7:
 Structure of samples brazed with NOCOLOK® Flux (left) and NOCOLOK® Li Flux (right) flux after 60 days in SWAAT

Already after 30 days of SWAAT, for both sample almost all the fins were detached from the tubes – thus the examination of the parts after 60 days of SWAAT was limited only to the tubes.

The surface of the tube in case of standard NOCOLOK® is corroded to a much higher degree than in the case of the part brazed with NOCOLOK® Li Flux.  The corrosion in both cases is initiated by intergranular attack; however later on it does not develop into pitting corrosion, but the removal of the tube material has laminar character.  It seems that NOCOLOK® Li Flux did not cause a change of the corrosion mechanism; it just delayed the corrosion processes.

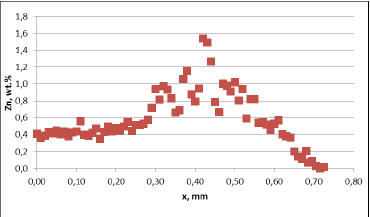
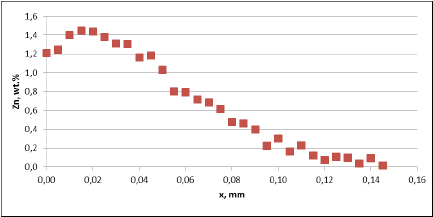
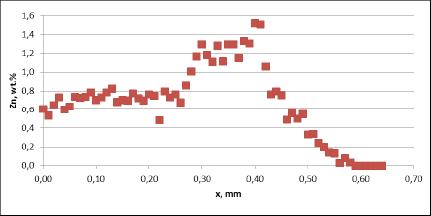
The higher corrosion rate for samples brazed with standard NOCOLOK® Flux observed in the microscopic structures has been confirmed by measuring the tube wall thickness.  Results of those measurements (at least 10 measurements per point) are presented in fig. 8.  It should be worth noticing that the standard variation for the wall thickness measured after 60 days of SWAAT was 10.9µm for fluxing with NOCOLOK® Li Flux and 81.2µm for fluxing with standard NOCOLOK® Flux.  Such a large variation in the wall thickness in case of NOCOLOK® Flux would indicate that the “long life” capacity of the protection mechanism in this case was practically exhausted.


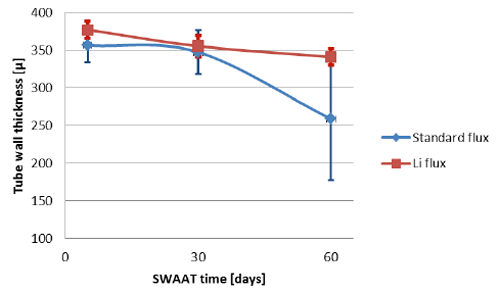
Fig. 8: Thinning of the tube wall during SWAAT

4 Conclusions

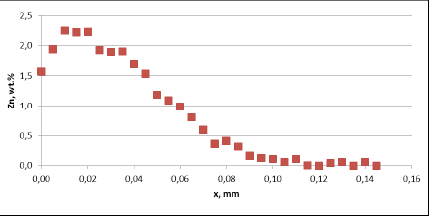
The experiment with the mock ups allowed for conclusions that there is no negative influence of NOCOLOK® Li Flux on the creation of Zn enriched sacrificial layer.  Presence of NOCOLOK® Li Flux in the mixture allowed for better protection of the sample parts against corrosion in stagnant water test.  One objective of stagnant water corrosion test is the simulation of stationary air conditioning unit humidity exposure.

It is possible to utilize in a flux mixture advantages of NOCOLOK® Zn and of NOCOLOK® Li.  Also as shown by testing with two different tube alloys, there is no significant difference in the tube thinning between different alloys.

Initial laboratory observations – that NOCOLOK® Li Flux improves resistance to corrosion in SWAAT condition – have been proven on industrial part.  Thus one option to increase the life time during SWAAT can be to use NOCOLOK® Li Flux.

Go to part 1

Literature

[1] A. Gray, H.W. Swidersky, L. Orman.
Reactive Zn Flux – an opportunity for controlled Zn diffusion and improved corrosion resistance.  AFC Holcroft 11thInternational Invitational Brazing Seminar, October 2006

[2] A. Gray, A. Afseth, H.W. Swidersky. The influence of residual flux level on the corrosion behavior of heat exchanger materials, ASST, May 2003

[3] Solvay Patent. WO10060869 A1 – Anti-Corrosive Flux – NOCOLOK®Li Flux, 2010

[4] Solvay Patent. WO11098120 A1 – Flux Forming an Insoluble Brazing Residue – Li Flux – Li3AlF6, 2011

[5] NOCOLOK®Li Flux New Brazing Flux with Improved Residue Performance

[6] NOCOLOK®Zn Flux – Technical Information

written by Leszek Orman, Radziszow / Poland; Hans-Walter Swidersky, Hannover / Germany

Abstract

In 2001 and in 2009 respectively, Solvay introduced two new fluxes for aluminium brazing: – NOCOLOK®Zn Flux (a ‘reactive flux’ – for the creation of precisely controlled sacrificial layers on part surfaces); and – NOCOLOK®Li Flux (for improving corrosion resistance of stationary air conditioning systems under stagnant water conditions).

When brazing with NOCOLOK®Li Flux, as validated on laboratory scale, some aluminium alloys show slightly better corrosion performance in SWAAT than parts brazed with standard flux.

On this basis, it was decided to investigate if a combination of NOCOLOK®Zn Flux and NOCOLOK®Li Flux can provide additional improvements in corrosion resistance.

Tubes of sample heat exchangers were coated with mixtures of Zn Flux and Li Flux – and brazed in an industrial furnace. Their corrosion resistance was checked by so-called soaking tests – i.e. by immersion in demineralized water over extended period of time.

In order to check the influence of NOCOLOK®Li Flux on corrosion resistance, some condensers were brazed under real industrial conditions, and their corrosion behavior was examined in SWAAT.

The results of this work indicate that a combination of NOCOLOK®Zn Flux and NOCOLOK®Li Flux can contribute to improved corrosion resistance at stagnant water conditions, and that NOCOLOK®Li Flux can delay corrosion attack in SWAAT.

1 Introduction

Corrosion resistance of heat exchangers exposed to different elements during service has been always one of the main concerns for the heat exchanger manufacturers and users. The most important methods for improving corrosion resistance of a given aluminium heat exchanger are:  selecting alloys for the exchanger parts in such a way that the galvanic potentials of the exchanger elements are properly balanced; creation of a sacrificial layer on a given part of the exchangers (usually tube surfaces); and coating the whole exchanger with a protective layer, which prevents a direct contact of the environment elements with the metal of the heat exchanger.

A common method for the creation of a sacrificial layer on the tube surface involves introducing Zn into the outer layer of the tube material.  Traditionally it is done by electro arc spraying of the extruded tubes with metallic Zn.  To improve the uniformity of the Zn enriched layer and to enable better control of the Zn diffusion profile, NOCOLOK®Zn Flux was developed [1].

With the flux on the aluminium parts to be brazed, a thin strongly adhering layer of post brazed flux residue remains on the surfaces after brazing.  Provided that this layer is uniform and covers all elements of the exchanger, it slightly improves corrosion resistance – acting as a barrier for element penetration [2]; however, for standard NOCOLOK®Flux this positive effect is not very strong.

Upon the introduction of all aluminium CAB produced condensers into stationary air conditioning systems, it was observed that the surfaces of such units – when exposed to stagnant water (for example from rain or condensation), can show signs of corrosion.  In response to that situation NOCOLOK® Li Flux was developed.  Reduced water solubility of NOCOLOK® Li Flux post braze flux residue has been attributed for slowing down corrosion rate of the brazed aluminium parts under stagnant water condition [3, 4].  Also it was observed that parts brazed with NOCOLOK® Li Flux (laboratory samples) show higher resistance to corrosion in SWAAT [5].  On this basis, it was decided to investigate whether a combination of NOCOLOK®Zn Flux and NOCOLOK®Li Flux can achieve further improvements of corrosion resistance, and if NOCOLOK®Li Flux can provide additional corrosion resistance for industrial parts in SWAAT.

2 Experimental

Determination of the flux mixture composition

In the first step of the experiment, brazing at industrial conditions of especially prepared mock-ups was performed (Fig.1). The primary task was to determine the correct proportion between the NOCOLOK® Zn Flux and Li cryolite (Li3AlF6). The mixture composition was established on an assumption that the lithium cryolite should react with K3AlF6(equation 2) in order to minimize the water solubility of the Post Braze Flux Residue [PBFR].  Thus the calculation was based on following reactions [1, 4]:

12 KZnF3 +  8 Al   →   12 Zn  +  6 KAlF4 +  2 K3AlF6                                (1)

Li3AlF6 +  2 K3AlF6   →   3 K2LiAlF6                                                           (2)

By adding the sides of equations 1 and 2 we obtain:

12 KZnF3 +  8 Al  +  Li3AlF6  →  12 Zn  +  6 KAlF4 +  3 K2LiAlF6             (3)

Substituting the atomic masses into equation 3, we obtain that the composition of the flux mixture should be:

NOCOLOK®Zn Flux – 91.7%; lithium cryolite – 8.3% by weight.  As stated in [6], a load in the range of 10 g/m2of Zn Flux (which corresponds to metallic level of Zn equal to 4g/m2) is sufficient for providing sacrificial layer on the substrate surface.  In order to envelope the above value for the current experiment 3g/m2and 6g/m2of metallic Zn load were chosen.  That corresponds to 8g/m2and 16g/m2of the NOCOLOK® Zn Flux + Lithium cryolite mixture.  Further on this mixture is called NOCOLOK®ZnLi Flux.


Fig. 1:  The assembled mock up with Data Pack thermocouples just before brazing

Materials used in experiment:

  • Flux: NOCOLOK® Zn Flux – 91.7% weight, lithium cryolite – 8.3% weight
  • Fins: HA 3968-K
  • Headers: HA 3905-R
  • Tubes, alloy 1: HA 9108
  • Tubes, alloy 2: HA 9170, both alloys coated on industrial machine (SAPA Precision Tubing) with NOCOLOK®ZnLi, load (8 and 16g/m2)

The fins, tubes and headers were manufactured by Hydro Aluminium Rolled Products.

Brazing of the mock ups was performed in industrial Active Only brazing line made by Seco/Warwick.  As measured by Data Pack®, the parts stayed at temperature over 580°C for about 5 minutes.

After brazing the Zn diffusion profile and resistance to the so called soaking test were evaluated.

3  Results and discussion

Mock up experiment

Zn diffusion profiles was measured by X-ray microprobe JXA 8230 made by JEOL. Applied accelerating voltage: 15kV with the beam current 30nA.  They were measured in two characteristic places: through the fin to tube joint and through the tube in the middle of the fin joints. This is shown in Fig. 2:


Fig. 2: Electron Back Scattered Image – example showing location of the analyses lines

Diffusion profile across the joint, Flux load 8g/m2, tube alloy HA9180
Fig. 3a:
  Zn diffusion profiles – as measured on the brazed mock ups, Diffusion profile across the joint, Flux load 8g/m2, tube alloy HA9180

Diffusion profile between the joints, Flux load 8g/m2, tube alloy HA9180
Fig. 3a:  Zn diffusion profiles – as measured on the brazed mock ups, Diffusion profile between the jointsFlux load 8g/m2, tube alloy HA9180

Diffusion profile across the joint, Flux load 16g/m2, tube alloy HA9170
Fig. 3a:  Zn diffusion profiles – as measured on the brazed mock ups, Diffusion profile across the jointsFlux load 16g/m2, tube alloy HA9170

Diffusion profile between the joints, Flux load 16g/m2, tube alloy HA9170
Fig. 3a: Zn diffusion profiles – as measured on the brazed mock ups, Diffusion profile between the jointsFlux load 16g/m2, tube alloy HA9170

Zn diffusion profiles – as measured on the commercial sample, Spot 1, Diffusion profile across the joint
Fig. 3b:
 Zn diffusion profiles – as measured on the commercial sample, Spot 1, Diffusion profile across the joint 

Zn diffusion profiles - as measured on the commercial sample, Spot 1, Diffusion profile between the joints
Fig. 3b: Zn diffusion profiles – as measured on the commercial sample, Spot 1, Diffusion profile between the joint 

Zn diffusion profiles – as measured on the commercial sample, Spot 2, Diffusion profile across the joint
Fig. 3b:
 Zn diffusion profiles – as measured on the commercial sample, Spot 2, Diffusion profile across the joint 

Zn diffusion profiles – as measured on the commercial sample, Spot 2, Diffusion profile between the joint
Fig. 3b:
 Zn diffusion profiles – as measured on the commercial sample, Spot 2, Diffusion profile between the joint 

For all mock up samples the depth of diffusion profiles is around 120 microns.  The maximum level of Zn concentration for lower flux load is at the range of 1.2% to 1.4% – and for higher flux load is in the range of 2.5%. These values seem to be typical for tubes coated with NOCOLOK®Zn Flux. Also the maximum content of Zn in the fillet seems to be rather well balanced with the Zn concentration on the tube surface (Fig. 3a).

For comparison, the diffusion profile of a commercial part was also investigated. In this case the diffusion profiles show quite significant differences – both in the depth of diffusion and the maximum Zn concentration on the tube surface. Also the Zn concentration is higher for fin to tube joint (Fig. 3b). This observation seems to be consistent with a well known fact that electric arc Zn coating is not uniform having places with high and low zinc load.

Go to part 2

Literature

[1] A. Gray, H.W. Swidersky, L. Orman.
Reactive Zn Flux – an opportunity for controlled Zn diffusion and improved corrosion resistance.  AFC Holcroft 11thInternational Invitational Brazing Seminar, October 2006

[2] A. Gray, A. Afseth, H.W. Swidersky. The influence of residual flux level on the corrosion behavior of heat exchanger materials, ASST, May 2003

[3] Solvay Patent. WO10060869 A1 – Anti-Corrosive Flux – NOCOLOK®Li Flux, 2010

[4] Solvay Patent. WO11098120 A1 – Flux Forming an Insoluble Brazing Residue – Li Flux – Li3AlF6, 2011

[5] NOCOLOK®Li Flux New Brazing Flux with Improved Residue Performance

[6] NOCOLOK®Zn Flux – Technical Information

flux-characteristics-and-transfer-systems-in-electrostatic-application


Attachment

Powder Fluidity Indicator

Definition of the Variables and Calculation of the Results

Preliminary remark:
The spraying factor Rm is a relative value for the evaluation of powders used for dry fluxing – especially when the material transport in the used equipment depends on the fluidization property of the powder.
Expansion factor:

Expansion factor [cm/cm] = Hfluid [cm] / H0 [cm]

For the calculation of the expansion factor, the mean values for Hfluid and H0 are used. The data for the mean values results from measurements of the powder height at 5 points.

Hfluid: powder height in fluidized condition
H0: powder height not fluidized and vibrator shut down
Hfluid = (Hfluid1+ Hfluid2+ Hfluid3+ Hfluid4+ Hfluid5) / 5
H0 = (H01 + H02 + H03+ H04+ H05) / 5

Powder flow (m) [g/ 0,5 min]
The mass (weight) of powder flowing out through the calibrated hole in 0.5 minutes calculated as median from 10 measurements.

Calculation of the median:

Median = m9+m2 / 2 for 10 single measures of m and m5< m3< m1< m7< m9< m2< m4< m8< m10< m6

Spray factor (Rm)

Rm [g/ 0.5 min] = m [g/0.5min]* expansion factor

The Spray factor results from the median of powder flow multiplied with the calculated expansion factor.

Go to Part 1

Go to Part 2

Go to Part 3

Go to Part 4

Go to Part 5

Go to Part 6

End of the article.

flux-characteristics-and-transfer-systems-in-electrostatic-application


Flux Transfer Systems in Electrostatic NOCOLOK® Flux Application

For these experiments, a fluxing booth from Nordson designed for semi-continuous production was used. This unit’s (216 cm height, 143 cm width, 270 cm depth) key components are a hopper, a spray gun, two filter cartridges and the necessary control units.
The work piece is placed on a grating, which can be manually moved back and forth. The spray gun automatically progresses from left to right and back in intervals of approximately 21 seconds (21 seconds for 65 cm; 3.1 cm/s).
Responding to recent market developments, a second flux transfer system was installed in this fluxer. An ITW/Gema hopper including spray gun and control unit were added to the booth.
The distance between the spray nozzles and the grating is 34 cm

Principles of Flux Transfer Systems in Electrostatic NOCOLOK® Flux Application

The Nordson hopper utilizes the principle of powder fluidization to convey the flux via a Venturi pump and a feed hose to the spray gun. An agitator in the hopper supports flux fluidization.
The ITW/Gema system has a hopper with a helix screw conveyor to mechanically transfer the powder into a funnel. From there, a Venturi pump transports the flux through a hose to the spray gun.
Both systems are equipped with vibrators in some positions to reduce flux buildup. The spray guns are operated with 100 kV to charge the powder.
The design of the Venturi pump and the electrical spray gun of the two systems are very different from each other. However, in view of the experiments described here, this was only of minor influence. The focus is on trends of flux behavior when samples with fine and coarse particle size distributions are compared. Using the technology type rather than the manufacturer’s name is even more in line with the objectives.

Experiments with Flux Transfer Systems:

Trials to determine the consistency of flux flow and deposition on radiators were performed, using sample 1 and sample 2 in the powder fluidization (Nordson) and the mechanical transfer (ITW/Gema) equipment.
As the first step, the control units (for flow air and/or helix speed) needed to be adjusted for each test to a flow rate that provided a flux loading of approximately 5 g/m². The experiment was then continued for 30 minutes without changing the equipment settings. In intervals of two to four minutes, radiators were placed on the grating for coating, and then weighed to determine flux loading. Each test series included ten or eleven units.
The results are summarized in the table ”Flux Deposition on a Heat Exchanger”. Material of sample 1 (”coarse” material) showed relatively consistent behavior in both systems. Variations are in a range of 0.7 g/m² with powder fluidization and 0.5 g/m² with mechanical transfer. For sample 2 (”fine” material), the findings indicate more significant fluctuation with powder fluidization. The range is 1.4 g/m². In the mechanical transfer system, the variations of sample 2 are lower, 0.5 g/m².
Due to the influence (and statistical variances) of the experimental conditions with different Venturi pump designs and different spray guns in both systems, the results only provide information on trends. As could be expected, the equipment relying on powder fluidization showed lower consistency with fine material. It is more difficult to fluidize fine material, and consequently it is more difficult to transfer flux powder by fluidization.
Sample 1, which has better fluidization properties, has lower fluctuations in both systems. This indicates a more beneficial performance of a flux powder with good fluidizing capabilities.

Mechanical Transfer System – Sample 1

6-1-mechanical-transfer-system-sample-1


Mechanical Transfer System – Sample 2

6-2-mechanical-transfer-system-sample-2


Table 3: Flux Deposition on a Heat Exchanger (30 Minutes Test)

6-3-flux-deposition-on-a-heat-exchange


Powder Fluidization System – Sample 1

6-4-powder-fluidization-system-sample-1


Powder Fluidization System – Sample 2

6-5-powder-fluidization-system-sample-2


These results were confirmed by other observations made during additional trials. Material with spray factors of approximately 45 g/0.5 min and higher (with good fluidization) flowed through the equipment pipes and hoses with less material buildup and created lower amounts of residue buildup on the spray nozzles. Large particles also partially compensate for the Faraday Effect, which makes it difficult for the electrostatically applied flux to penetrate the fin package (center of heat exchanger with tubes and fins).

Conclusions:

The experimental work for this paper identified and evaluated essential performance characteristics for electrostatic flux application:

  • Powder fluidization
  • Powder adhesion

The flux particle size distribution and the relative ratio of fine particles in the flux powder are key factors in dry fluxing.
A specific proportion of fine material in the flux is important for adequate adhesion.
Larger particles contribute to proper fluidization.
Equipment parameters for electrostatic fluxing must be adjusted to suit the specific flux properties.
Fluxes utilized for electrostatic application need improved fluidization characteristics, but not at the expense of adherence performance.

Go to Part 1

Go to Part 2

Go to Part 3

Go to Part 4

Go to Part 5

Go to Part 7

To be continued …

flux-characteristics-and-transfer-systems-in-electrostatic-application


Flux Powder Adhesion:

Dust formation and flux fall off are of general interest to the brazing industry. Regardless of the application method, dust generation (particularly airborne fines) must be avoided or kept to a minimum. If dust formation cannot be prevented, local exhaust ventilation and meticulous housekeeping are recommended.
The inhalation of flux dust in high concentrations over a long period of time constitutes a health hazard to exposed personnel. Due to the abrasion caused by flux dust, unprotected equipment surfaces of moving parts can show premature deterioration if not regularly maintained.
As mentioned above, flux adhesion in dry application is lower than in wet application. Forced convection heating zones are one possible area in the process where flux losses may occur. Other factors might be manual transfer of units or vibrations during mechanical transport. Some users improve adhesion by applying the powder on surfaces still lubricated with residual evaporative oils.
When excess flux dust is generated in the drying oven or the furnace, it can get into the exhaust steam and create difficulties with the exhaust treatment (i.e., quickly overload the filter or scrubber). If the exhaust is treated with thermal or catalytic processes (i.e., incineration of evaporative lubricants), separation of solid and gaseous components can become necessary.
Excess flux dust in the brazing furnace can also settle on the conveyor belt or on the furnace muffle. The conveyor belt can take this powder through the brazing zones, where it eventually melts. This may contribute to accelerated corrosion.

Users of dry fluxing technology are aware of the reduced flux adhesion. At most of the operations we were allowed to visit, dust formation due to flux fall off is kept to minimum levels by appropriate technical installations.

Experiments for Flux Powder Adhesion:

We researched the ability of flux powders to adhere to aluminum surfaces in electrostatic application. A very simple test was used to determine adhesion tendencies. This experimental arrangement is not simulating real production conditions. Nevertheless, it provides very useful information.
A plain square aluminum plate (0.5 m x 0.5 m) is electrostatically coated on one side with flux powder. The total flux weight is determined to calculate flux loading. The plate is then dropped (in vertical position) from 5 cm height to the ground and the flux loss is registered as percentage of original flux weight.
Attached is a diagram with the results for flux sample 1 and sample 2. For each material, ten measurements were performed. There is a certain variation of the individual figures; nevertheless, the trend is obvious. Sample 1 (”coarse” material) shows an average loss of approximately 33% compared to approximately 3% of sample 2 (”fine” material). This general tendency of powder with larger particle size distribution to adhere less than fine powder was also confirmed by additional experiments we made. The flux fall off in wet flux application under these test conditions is approximately 1%.

Dry Flux Application on an Aluminum Plate (0.25 m2) Flux Loss for a Fall from 5 cm Height

5-1-dry-flux-application


Flux powder is electrically charged in the gun. Usually, adhesion in electrostatic application is dependent on electrical forces. The flux loses the charge when it hits the grounded heat exchanger. Gravitational forces are now competing with relatively weak Van-der-Waals forces. This explains why fine particles adhere better.
Large flux grains are affected more by gravity, and consequently fall off more easily. We were able to synthesize a flux with very large average particle size distribution which fluidized perfectly (spray factor 143 g/0.5 min; i.e., twice as ”good” as sample 1). However, when this material was used for electrostatic application, the air flow from the spray gun blew away a lot the flux just deposited on the surface.

Go to Part 1

Go to Part 2

Go to Part 3

Go to Part 4

Go to Part 6

Go to Part 7

To be continued …

flux-characteristics-and-transfer-systems-in-electrostatic-application


Experiments for Flux Powder Fluidization:

To illustrate the relationship between flux properties and fluidization, a series of tests was carried out using Sample 1 and Sample 2. Attached are print-outs of the particle size distribution analysis (Sympatec Helios H0851; dry powder analysis with laser) of both materials.

Table 1: Particle Size Distribution

4-1-particle-size-distribution

Sample 1 shows coarser grain structure than sample 2. There are considerably more fine particles in sample 2, and most of that material has a size of below 5 μm. The spray factor of sample 1 (”coarse” material) is 71.88 g/0.5 min. This correlates with very good fluidization properties which was confirmed during tests in the electrostatic spray booth (see below).

Sample 1

4-2-sample-1-particle-size


4-3-sample-1-volume-destribution


For sample 2 (”fine” material), a spraying factor of 7.35 g/0.5 min was found. This reflects extremely poor fluidization properties, also confirmed by tests in the spray booth. The above indicates that there are at least three material characteristics connected to particle size affecting fluidization:

  • Average particle size
  • Quantity of fine particles
  • Maximum particle size

Sample 2

4-4-sample-2-particle-size


4-5-sample-2-volume-destribution


To further identify the effect of these factors, we tested mixtures of the two samples. In increments of 10%, sample 1 and sample 2 were blended. Then the spray factors of the mixtures were determined.

Table 2: Spray Factors in [g/0.5 min] of Sample Mixtures

4-6-spray-factors


As illustrated in the graph (see attachment), the relationship of spray factor and sample mixture ratio is not linear. Instead, it shows a rapid decline once the content of fine material is approximately 20 to 30%. We were able to specify the spray factor range of successfully performing flux powder to approximately 45 g/0.5 min in experiments with our dry fluxing booth, and from situations reported by our customers.

Spray Factor for Sample Mixtures

4-7-spray-factor-for-sample-mixtures


The ability of a powder to fluidize is very important for its performance in electrostatic application. However, it is not the only factor.

Go to Part 1

Go to Part 2

Go to Part 3

Go to Part 5

Go to Part 6

Go to Part 7

To be continued …

flux-characteristics-and-transfer-systems-in-electrostatic-application


Flux Powder Fluidization:

In an effort to develop a flux with more desirable properties for electrostatic application, the first step is to qualify criteria. In summary of the above, it is apparent that fluidization is one of them. There is standard equipment available on the market to quantify fluidization characteristics. However, when we tested these fluidity indicators, we found the fluidization ability of flux powder to be so poor that the results were meaningless unless a vibration unit was attached to the equipment. A photo of the modified installation can be found in the attachments. We combined a Binks-Sames powder fluidity indicator (AS 100 – 451 195) with a Fritsch vibration unit (L-24). The equipment consists of a fluidizing cylinder with a porous membrane on the bottom. The cylinder is mounted to a vibrator with a fixation plate. After the sample material (250 g) is placed in the cylinder, the vibration is turned on (via the vibrator control unit) and a consistent flow of dry nitrogen (via the fluidity meter control unit) is forced through the porous membrane. Depending on its potential to fluidize, the powder will start to expand until an equilibrium is reached (one minute). Measurements of the original and the fluidized height are taken at different points (see attachment).

3-1-fluidmeter-vibrator-control-unit

Powder Fluidity Indicator

3-2-indication-of-the-locations-for-the-measure-of-the-height-of-the-powder

Indication of the locations for
the measure of the height of the
powder in both fluidized and
non fluidized condition.

3-3-collecting-powder-as-it-comes-out-of-the-calibrated-hole

Collecting powder as it comes out of the
calibrated hole.

The second parameter determined with this device is the weight of powder flowing through a small hole on the side of the cylinder (as can be seen on the picture). Similar to the above procedure, the sample is fluidized in the cylinder. The side hole is then opened for 30 seconds, and the powder flowing out is caught in a beaker and weigh.

The spray factor is a combination of the expansion factor and the powder flow. Especially in dry flux application, where the material transport depends on fluidizing properties, the spray factor presents an important relative figure for powder evaluation.

Go to Part 1

Go to Part 2

Go to Part 4

Go to Part 5

Go to Part 6

Go to Part 7

To be continued …

flux-characteristics-and-transfer-systems-in-electrostatic-application


The background of electrostatic flux application:

When controlled atmosphere brazing with non-corrosive fluxes was introduced, the only realistic method for using the flux was wet application. This strategy was supported by the physical and chemical properties of flux powder.

Non-corrosive fluxes for aluminum brazing consist of potassium fluoroaluminates (inorganic fluorides) with low water solubility. The majority of the flux products on the market are manufactured by precipitation in aqueous solution. These show a rather fine particle size distribution, i.e. from one to fifteen micrometers (1 – 15 µm) for most of the grains (50% and more) and reaching from 0.5 – 50 µm with an average particle size between four and ten micrometers (4 – 10 µm). This type of powder is ideal for slurry application, as the fine particles prevent the flux from settling too fast. Also, when sprayed on a clean surface under wettable conditions, they present a uniform, very thin and fully adhesive coating after drying. As mentioned earlier, the flux slurry needs to be agitated continuously and the concentration must be monitored in order to guarantee consistent flux loading (i.e., flux weight per surface area).

The most significant problem in wet application is waste water. With stricter requirements and limitations for trace impurities in waste water, the pressure to reduce water consumption increases. At the same time, production capacity is expanding worldwide. Waste water treatment is expensive, and some brazing operations have limited experience in this field. In addition, more and more facilities are constructed in areas where water appropriately treated for flux slurry preparation is scarce and costly.

The challenges of electrostatic flux application:

Electrostatic powder coating has been standard technology for many years, and it was only a question of time before it was also realized in flux application. The following will focus on essential flux properties and basic equipment arrangements.

Some material characteristics of non-corrosive brazing fluxes make it difficult simply to transfer the normal powder coating equipment to the fluxing area and use it there. Most powders utilized for electrostatic application are either designed with special properties or already contain them. Important elements are:

  • Particle shape and particle size distribution
  • Ability to accept and to hold electrical charge

Particle size distribution has a significant influence on the ability of a powder to fluidize and to flow. Better fluidization characteristics lead to better equipment performance. Consistent flux transfer and the ability to flow through pipes and plastic hoses is directly affected by fluidization. Additionally, it has been observed that good fluidizing material shows less tendency to build up in the equipment. Buildup can quickly result in interruptions of the flux flow. When this buildup is expelled the nozzle may release an excessive amount of flux. This excess will in turn be deposited on the surface of the part, resulting in non-uniform flux distribution. It is possible to induce charge on flux when it travels through an electrical field. However, the powder, by its chemical and physical nature, displays instantaneous charge decay when it hits the grounded heat exchanger. Therefore, the forces that adhere the flux to the part are not electrostatic forces, but are more likely Van der Waals forces. In dry flux application, the following complications have been described by users when operating conventional flux qualities:

  • Fluidizing the powder and material transport is difficult. Vibration or stirring is necessary to improve on these characteristics
  • Problems with consistency of flux flow and uniformity of applied flux
  • Adhesion of deposited flux is inferior when compared with wet application
  • High humidity causes physical adsorption of water molecules to the fine powder dust in the booth. This may result in agglomerations
  • Recovering, recycling and reusing flux requires special attention

Go to Part 1

Go to Part 3

Go to Part 4

Go to Part 5

Go to Part 6

Go to Part 7

To be continued …

flux-characteristics-and-transfer-systems-in-electrostatic-application


Introduction:

This article summarizes some experimental results of a project on electrostatic application of non-corrosive fluxes for aluminum brazing. The objective is to qualify and quantify flux powder properties and equipment parameters with positive effect for dry flux technology.

For more than 30 years, controlled atmosphere brazing (CAB) [NOCOLOK ® Flux brazing] has been the leading technology for the manufacture of aluminum heat exchangers for the automotive industry.

The most common flux application method is by spraying an aqueous suspension. Constantly agitated flux slurries with concentrations of approximately 10 – 35% solids are pumped from tanks to fluxing booths. All aluminum surfaces involved in the brazing process are coated with the slurry, resulting in a uniform flux layer. Excess flux slurry is removed with a high-volume air blow; the excess is then collected, recycled and reused in the fluxing booth. Before going into the furnace, the heat exchangers are pre-dried in a separate drying oven to remove residual moisture.

In wet flux application, the following are critical factors and need specific observation by the user:

  • Flux slurry concentration
  • Consistency and uniformity of applied flux
  • Flux loading on heat exchangers
  • Drying step

Depending on the particular brazing operation, flux slurries may become contaminated with dust, metal particles, rust and organic compounds. The used slurry also contains the soluble portion of the flux (i.e., small levels of potassium, fluoride and aluminum), and must therefore be treated and then disposed of in accordance with environmental regulations.

Over the past five years, some users of NOCOLOK brazing technology have implemented dry flux application methods. Based on the principles of powder paint technology, an alternative application technique was introduced in the brazing industry.

The benefits of electrostatic application are directly related to the problems of wet application:

  • No need to mix slurries
  • No need to monitor slurry concentration
  • No need for a surface wettability concept (i.e., surface treatment or wetting agent)
  • No separate drying step required to remove moisture
  • No waste water effluent

Particularly when dry fluxing is used in connection with evaporative oils and lubricants, the objective is to eliminate or significantly reduce water consumption during the process.

Go to Part 2

Go to Part 3

Go to Part 4

Go to Part 5

Go to Part 6

Go to Part 7

To be continued …

What is NOCOLOK® Cs Flux (SM)? (Synthesized Material)

NOCOLOK® Cs Flux is used for brazing of aluminium alloys with higher magnesium levels. The Cs flux currently available for CAB (Controlled Atmosphere Brazing – furnace brazing) is a technical mixture (i.e. a mechanical blend) of K-Al-F flux (NOCOLOK® Flux) with Cs-Al-F flux – this product is offered under the name NOCOLOK® Cs Flux (TM): Technical Mixture. 

The new NOCOLOK® Cs Flux (SM) is a fully synthesized material – i.e. a unique and homogenous product. The Cs is completely embedded in a Cs-K-Al-F matrix during the manufacturing process.

Advantages

When comparing the characteristics and application of blended Cs Flux „(TM)“ with synthesized material „(SM)“, there are notable advantages of the new quality:

  • The mixture can show settling and separation in flux slurries and paints.  This is caused by differences in the density, the particle size, and the solubility of the two compounds in the blend.
  • In the new fully synthesized material – with the Cs completely incorporated in a Cs-K-Al-F matrix – the density is consistent and the particle size more uniform.  We have a homogeneous powder with improved stability in suspensions (i.e. for slurries, paints, and pastes).
  • In addition, the overall solubility is reduced when compared with the blended material.
  • There will be less settling and less separation – which means that there is  enhanced application performance with NOCOLOK® Cs Flux (SM).

NOCOLOK® Cs Flux (SM) is on stock at our Wimpfen facility and available right away. 

Worldwide Registration

For a number of years, more and more countries are converting their existing chemical regulations or are implementing new regulations. In many cases, these regulations ​c​an be considered as an adaption of the European REACH Regulation. A registration of chemical substances or reaction masses is required, including comprehensive material data sets and risk assessment. 

Solvay appreciates and supports these new product safety initiatives.
As a consequence, however, this leads to that in order to fulfill all regulatory requirements new products can only be introduced stepwise to other countries.

NOCOLOK® Cs Flux (SM) has already been successfully registered according to the European REACH Regulation and can be used without restriction within the European Union. Please also refer to our Safety Data Sheet, which is available on request. Registration for other countries/regions will be done successive. For more information, please contact our local sales offices.​