In everyday practice we can encounter problems connected with brazing imperfections – often manifested as leaking. In order to identify the failure root causes, usually a detailed examination needs to be perform. Optical metallography is one of the most important tools for such an analysis.
Schlagwortarchiv für: Metallurgy
In everyday practice we can encounter problems connected with brazing imperfections – often manifested as leaking. In order to identify the failure root causes, usually a detailed examination needs to be perform. Optical metallography is one of the most important tools for such an analysis.
Sample Preparation – Orientation
The heat exchanger chosen for the purpose is a NOCOLOK Flux brazed radiator. To provide some orientation as to where the metallographic sections will be taken from, Figure 1 shows the water-side header area (top) and part of the finpack, sidesupport and header area.

Figure 1
In most metallographic investigations of brazed heat exchangers, the critical joints to examine are the tube-to-header joints and the fin-to-tube joints. For instance, a leak in a tube-to-header joint constitutes a failure. The fin-to-tube joint on the other hand, although not as critical as the tube-to-header joint, is the key area where heat transfer takes place. It is therefore necessary that the fin-to-tube joints are metallurgically bonded (i.e. brazed) for maximum heat transfer efficiency.
Sample Preparation – Sectioning
With a band saw, the radiator can be cut down through the center of the tubes (see Figure 2). This will keep the fins intact. If necessary, one can saw through the fins if the blade is kept as close to the outer tube wall as possible. That is the outer tube wall can be used to guide the saw blade. Otherwise, it is better to saw through the center of the tube where the inner walls will act as the guide.

Figure 2
Once the above sections have been obtained, the samples can be sawn longi-tudinally through the center of the tube and header as shown in Figure 2, right. The tube-to-header and tube-to-fin sections can then be cut. The size of the cut samples must fit inside a 30 mm or 40 mm mount. Note that it is the cut face that will be grinded and polished.
Grinding and Polishing
The following section shows what the sample actually looks like after each grinding and polishing step. The intention is to help the metallographer track the progress of grinding and polishing with the help of visual aids.
Figure 3 shows what a section of „unbrazed“ brazing sheet looks like under the microscope after wet grinding with 220, 500 and 1000 grit SiC paper. In each case, the sample is ground until all the grinding lines appear in the same direction, across the entire grinding face. It also helps that the grinding lines go in the direction of, or perpendicular to the area of interest. In this case, the grinding lines all run perpendicular to the braze sheet after 220 grit paper. After 500 grit paper (rotating the sample 90°), the grinding lines all run parallel to the tube and after 1000 grit, once more perpendicular to the braze sheet.
Figure 4 shows what the braze sheet looks like after each successive polishing step. After the 6 µm diamond suspension, the microstructure of the braze sheet becomes visible (more on microstructure later). At this stage, there are still a number of scratches. After the 3 µm diamond suspension, the micro-structure is clearer and there are less scratches. Only after the colloidal silica are all scratches removed. The 64x magnification in Figure 4 is too small to reveal fine micro-structural details after the colloidal silica polish, but what is evident is that the braze sheet is now highly polished and scratch free.
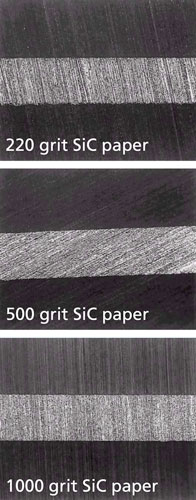
Figure 3
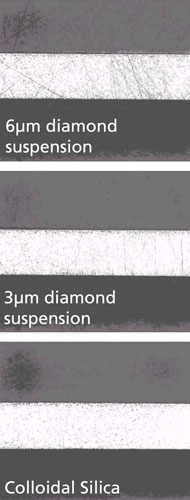
Figure 4
Case Study
A radiator core retrieved from service was examined for a suspected premature corrosion related failure.
Upon closer metallographic examination, no evidence of corrosion was found at the failed area.
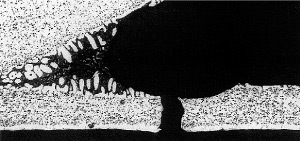
33% tube core erosion in the failure area
Header: AA4343/ AA3005
Tube: AA4343/ AA3003
It was concluded that the cause of the failure was in fact a mechanical failure occuring in the thinned wall area.
The following sequence of events proposes a rational explanation for the eroded tube area:
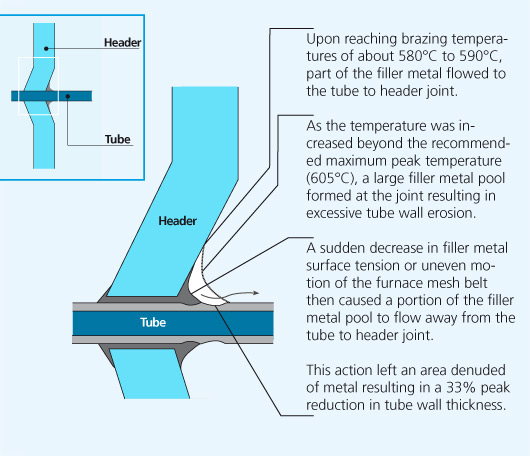
In service radiators are subject to internal pressure fluctuations and expansion and contraction due to heating and cooling. Mechanical failure was imminent and occured in the weakest part of the tube, the thinned down tube wall area adjacent to the tube to header joint.
Conclusions
Erosion of the base metal is undesirable since it reduces the wall thickness of the brazed component.
In addition Si penetration in the grain boundaries is known to increase the susceptibility to intergranular corrosion. Therefore proper filler metal management practices should be observed to prevent undesirable effects. One such factor easily controlled by the brazer is maximum peak brazing temperature.
Experimental
The effect of temperature on filler metal erosion was studied using an automotive radiator core.
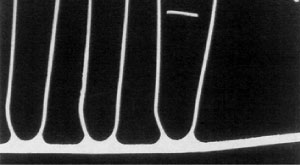
610 °C for 2 minutes - no thinning of the tube core
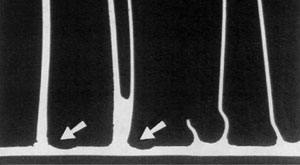
625 °C for 2 minutes - significant erosion of the tube core
In this case, joining progresses initially as expected. The cladding layer on the tube melts and flows by capillary action to the fin to tube joint and a normal fillet forms. However, as the peak brazing temperature is allowed to rise beyond the recommended maximum (605 °C) the following occurs:
- The fluidity of the filler metal at the tube to header joint is increased and some of the liquid filler metal is released and flows to the nearest tube to fin joints.
- Excess filler metal at the tube to fin joints accelerates dissolution of the tube core adjacent to the fin, eroding the tubewall thickness.
- The excess filler metal pool is then drawn by capillary action in between the fins, particularly where the finspacing is narrow. The fins are drawn together by the strong capillary forces, displacing the fin from its original fin to tube position.
- As the fins move together, drawing the filler metal pool from its original position, the denuded area is significantly reduced in cross sectional thickness.
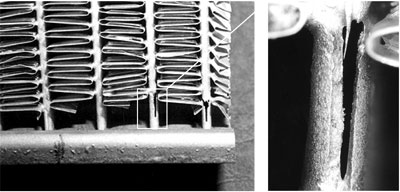
In some instances the extent of filler metal erosion is so severe that the entire thickness of the tube is consumed resulting in catastrophic failures.
More about this topic in our next issue.
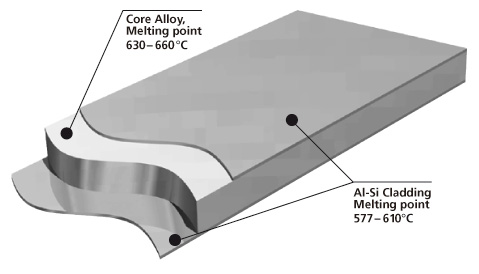
Brazing sheet comprises of a core alloy clad on 1 or 2 sides with a lower melting aluminum-silicon (Al-Si) alloy. This thin layer, usually makes up 5 % to 10 % of the total thickness of the brazing sheet.
It melts and flows during the brazing process, to provide upon cooling a metallic bond between the components. It is common that the braze clad alloy are from the AA 4xxx series or more particularly AA 4343 (Al-6.8~8.2 wt.% Si).
However, if larger fillets are desirable, or if in a situation where brazing is likely to occur at lower temperatures, AA‑4045 is the preferred choice.
Manufacturing

Cross-section morphology of a double-side clad tubestock.
Aluminium brazing sheet is manufactured by roll-bonding techniques to clad a core alloy ingot on one side or both sides with a low melting AlSi alloy. As an alternative, one side can be clad with a non-braze alloy, e.g. Zn-containing alloy.
Depending on the desired final properties, the core is either homogenized or not before the cladding operation.
The whole package is subjected to preheating, hot rolling and cold rolling down to the final thickness of the respective products. Depending on the requested final properties, the material is subjected to final annealing and / or intermediate annealing operation(s).
The core provides structural integrity. It is common to use a variety of aluminium alloys, examples being AA 3xxx (AlMn), more particularly AA 3003, AA 3005, AA 3105 and modified versions of AA 3003 or AA3005 (long life alloys).
Phase diagram
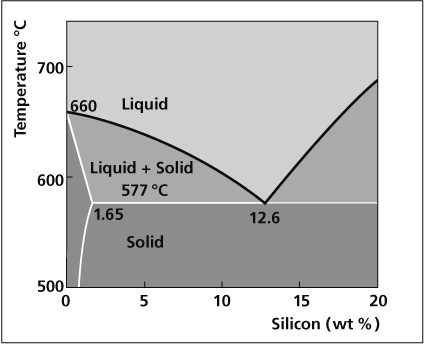
Aluminum End of Al-Si Phase Diagram
The melting characteristics of the cladding alloys are governed by the Al-Si phase diagram. The eutectic composition, i.e. the amount of Si required to produce the lowest melting point is 12.6%. The melting point at this composition is 577°C. At lower Si levels the solidus or the point at which melting begins is also 577°C. However, melting occurs in a range and the temperature above which the filler is completely molten is called the liquidus. In between the solidus and liquidus, the filler is partially molten, existing both as liquid and solid. The difference between the solidus and the liquidus forms the basis for various filler metal alloys.
The table below shows the solidus and liquidus of common brazing alloys.
[table id=2 /]
The higher Si alloys (e.g. AA4047) have higher fluidity and a narrower melting point range while the lower Si alloys have less fluidity with a wider, higher melting point range. Erosion of the base metal occurs when the braze alloy dissolves part of the core alloy. The extent of erosion is increased by:
- Higher Si levels in the braze alloy
- Longer braze cycles
- Excessive peak brazing temperatures
- Excessive thickness fo the braze metal layer
- A design which allows pooling of the braze metal to occur
Aluminum alloys are classified according to their alloying elements. The Aluminum Association designations are listed in the table below:
Designation System for wrought aluminum alloys
Alloys series Description or major alloying element
1xxx 99.00% minimum Aluminum
2xxx Copper
3xxx Manganese
4xxx Silicon
5xxx Magnesium
6xxx Magnesium and Silicon
7xxx Zinc
8xxx Other Element
9xxx Unused Series
The chemical composition of each AA alloy is registered by the Aluminum Association and a few examples are listed:
Example of aluminum alloy composition limits in weight percent*
[table id=1 /]
*Maximum, unless shown as a range
